I have an online experiment with multiple tasks and multiple participants. I set the results to be downloaded in a Database format (not .csv). When I first downloaded the database (after about 10 participants), the Database was clean, no rows were scrambled. The issue is that when I downloaded the database a second time (after about 60 completed sessions), many rows in the database are misaligned with the columns - the data on certain rows is not what it is supposed to be found in that column (see picture below). I couldn’t find a pattern of misalignment and I have difficulty finding complete data in this file.
I tried to recover some data from the .log files that are saved in the repository, but I don’t find all the filed that I should - I have a total of 67 completed sessions and 42 aborted ones, so there should be 109 .log files in the repository, both with complete and with incomplete data - is this right? If so, why can’t I find them?
Is it possible that there’s something in the responses that looks like a “new cell” (e.g. comma) or “new line” and the issue is being generated when you import the file to your spreadsheet, rather than when the csv is generated from the database?
(I think we’d need the username/project to investigate further on our end)
So, based on wakecarters point, I checked the rows that are misaligned and they all seem to start with a “ character that comes before a recording of multiple rts - e.g., "[0.9086999999880732 (we have a keyboard component that must record all key-presses in a routine and their associated rts and the rows seem to start with the first value recorded by this component). This means that each rt that should be recorded in a single cell between ‘’ and separated by commas is actually situated in successive separate cells. The “ seems to break the role of the paranthesis in preventing commas inside being interpreted as new cells.
I am not sure why this is happening for this output specifically. I opened the database in Notepad and I find multiple variables that are between paranteses and ““. For example, the same keyboard component also records all the keys that were pressed with the same format (ex., “[p,p,q,q,p]”) and the “ here does not seem to start new rows.
Anyways, my default app for opening .csv files is MS Excel, so based on what jon said, I managed to solve the problem: I opened the .csv file in R as a dataframe - there, all values are where they should be. I exported the df from R in an Excel format just to see if the rows are correct now and they all seem to be in order.
Is it possible that the problem was just because of the way in Which MS Excel translates .csv files or is there something I should check in the participant answers or when the keyboard component starts/what it records?
Sorry, one more issue - the counter in the platform indicates 68 submitted sessions and 42 aborted sessions. This means that the 68 people in the submitted category should have theoretically gone from the beginning to the end of the experiment and have complete data, do I understand correctly? However, I can only find 66 participants with complete data and 4 with incomplete data (I guess from the aborted category). Is it possible that not all data was recorded in the DB or in the .log files? Was the platform affected by the recent cloudflare issue or is there some other aspects that I should check?
If you can only find 66 out of 68 completed participants, did you run two participants (e.g. pilots) before you switched to database saving? There might be separate csv files for them (unless you deleted them).
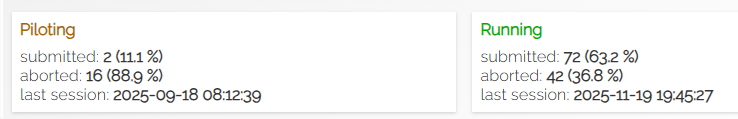
Yes, I had 2 completed pilot sessions and 16 aborted pilot sessions. And in the running section I now have 72 completed session, but only 70 completed participants in the database.
So this means that the completed sessions counter from the Running section also counts the completed sessions from the pilot, but these sessions are not included in the .csv database. Do I understand correctly?
Excel is the problem. Its automatic import routine messes up the data structure. You could either use different a spreadsheet program to open the csv, e.g. the ones from OpenOffice, LibreOffice or Numbers from apple do a better job than Excel.