Progress Bar (for IGT)

Windows 10
PsychoPy(v2022.2.5)

I am currently working on the Iowa Gambling Task and was wondering of how can I recreate this number-movement-bar-graph (look below for the screenshot from another study) above the cards to show how much the participant has won/lost after each click on one of the card decks - a total sum of their winnings. I would like the bar to move after each trial, each selection of the card.

I was thinking of using the Slider option, but not sure how to achieve it.

Thank you.

Hey Maxi,
It looked like something fun to figure out, so I created this feature with the slider, as you suggested.
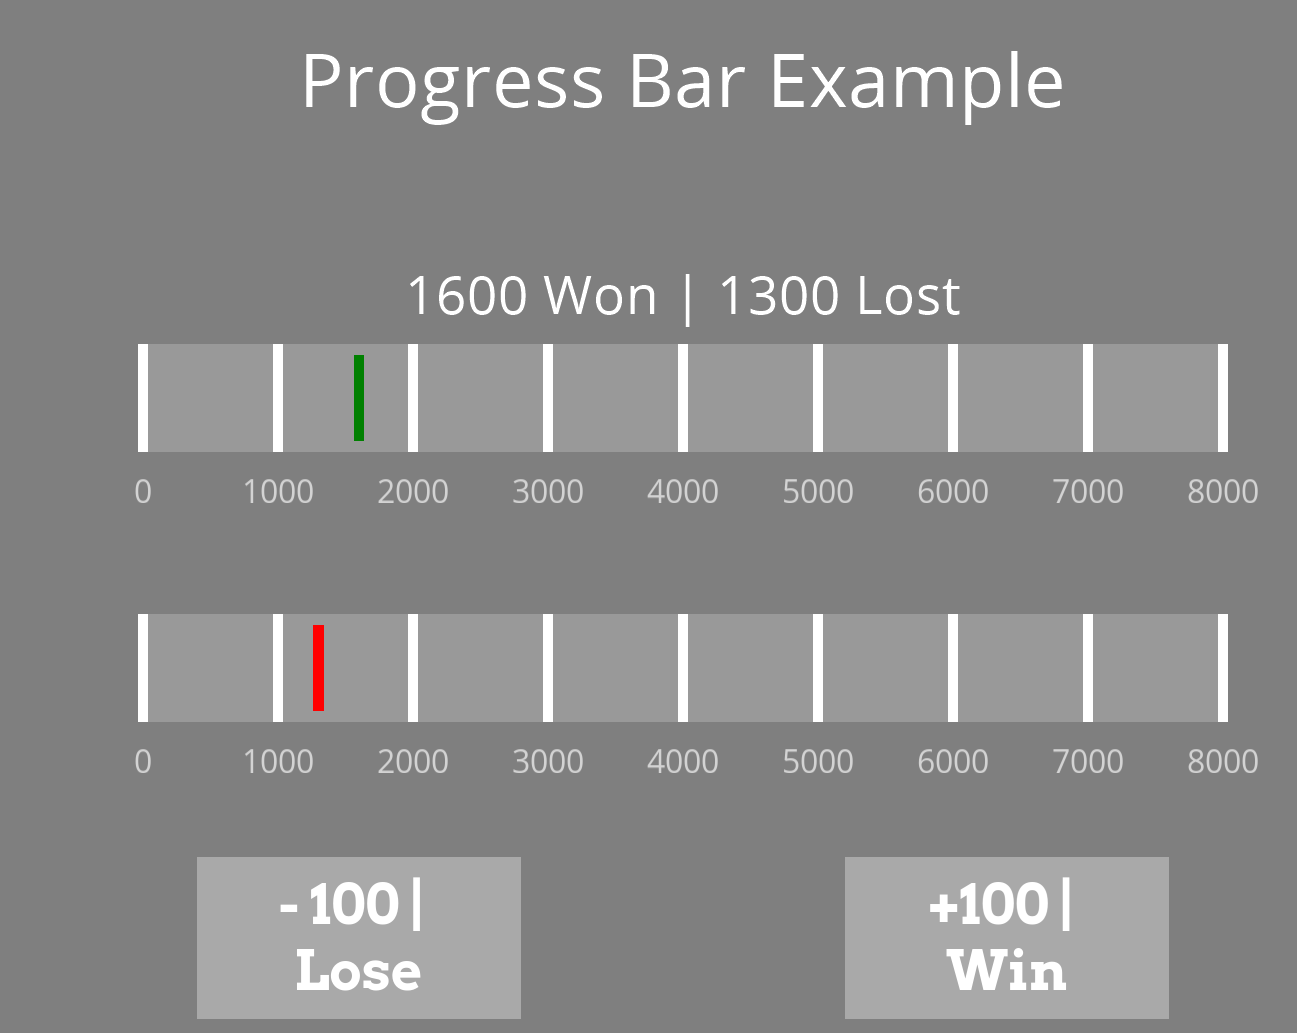
Take a look at what it looks like:

Download for the example:
IOWA Gambling Task Progress Bar.zip (132.2 KB)


Explanation:

At the start of the experiment, we set 2 variables, one for the wins and one for the loses:

# Begin Experiment:
win_sum = 0
lose_sum = 0

We have two buttons in the experiment, one demonstrating wins (+100) and one demonstrating losses (-100). Whenever one of those buttons is pressed, we increase the corresponding variable by 100:
Win Button: win_sum += 100
Lose Button: lose_sum += 100
When either of the buttons is being pressed, a new routine starts.

Whenever a new routine starts, we set the win_lose text to:

$str(win_sum) + " Won | " + str(lose_sum) + " Lost"

Meaning we will get the updated variables in our text component.


Now for the sliders.
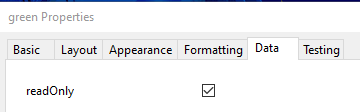
We have a green slider (wins) and a red slider (loses) with the following settings:

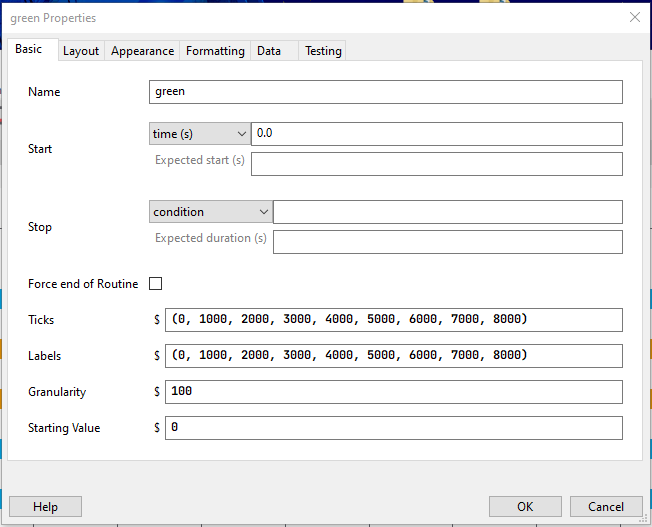
And readOnly ticked so the participant won’t be able to modify the slider:

At the start of each routine, we set the starting value of each slider to the corresponding sum:

green.startValue= win_sum
red.startValue = lose_sum

It should do the work, and in my opinion, it looks great :slight_smile:

I hope it helps and gives you a solid direction!
Chen Brilling

1 Like

Hi Chen,

Thank you so much for helping me out with this task! It is what I was looking for, especially enabling the movement of the marker, on which I was stuck on.

I will modify it for my own use a bit differently but it will do its job!

The red marker is not supposed to represent “loss”, but rather “loaned” money (which should occur minimally during the experiment if not none). However, super useful information for me!

Many thanks!

1 Like

Hello,
Happy I could help!
You are right about the loss-loaned money. It was just easier to distinguish between them, and the main point here was the functionality :slight_smile:

Good luck!
Chen

Hey Chen,

Thanks again for your response! It is really useful!

However, I was wondering how can I make the green slider go both ways in terms of a total number (e.g., when a value is +100, going to the right, and then another value is -100, going to the left (back to where it came from))? At the moment, the values only go up, increase, because they are positive.

Additionally, when I made the slider not a slider but rather a scrollbar, but at the moment I am unable to make it scroll from the value of 0 and instead it travels as a non-continuous block forward. How can I make it like an actual scrollbar that stays at 0 but continues up or down depending on the value? (a screenshot will be uploaded soon).

Thanks.

Hello,

I set the function of the button this way:

You can change the function from +100 to -100. You can also use a variable instead of those hard-coded values.

Regarding the second question, please provide the screenshot; it’s unclear what your intention is.

Thanks,
Chen

Hi,

Let me rephrase my question: How can I make the green bar correspond to the total value (in this case money), meaning how can I make the (tiny) rectangle within the bar move left and right based on the current total value (look at the screenshot from my first post). What is the specific coding because I tried using various codes, including the $ sign and did not work.

Additionally, the options for the types of sliders in psychopy is 4, how can I make the the size of the slider scrollbar longer, correspond, to the total value (in this case money - look above for the screenshot).

If I do not make much sense, you can ask me for rephrasing or something else :D.

Thanks.

How do I make a code that would add a value of 2000 if the total sum reaches a value below 0 (for the green.Slider)?

I tried using the function of;

if win_sum < 0:
win_sum +=2000

,but the code does not seem to be working.

Hey,
I need to see the complete code you are using. For example, where and how did you set the win_sum variable?
You need to set win_sum before the experiment starts inside a code component.

This can work for you:

if win_sum <= 0:
    win_sum = 2000

I got a little confused with all the questions, please break them into separate questions, and I will happily address each one :slight_smile:

Thanks,
Chen

Hey,

I have already found a solution on my own, but there is still one minor cosmetic issue that I cannot find an answer to. How do I make the slider style of the scrollbar start at the value of 0, the left side at still, but the right side of the slider moves up and down in values depending on the positive or negative value received? I am currently using the slider style called a slider, which only shows a marker, but I want it to show a bar that the left side of it is always still, but the right side of it keeps on moving depending on the value (the starting value is at 2000 for example).

Thanks.

Hey there,
Great question. I don’t think it’s possible using the slider, but it can easily be achieved using a polygon.
What we are going to do is create a polygon for each slider. It will have the same height and width as the slider.
Instead of centering the polygon to the center, we will set the anchor point to the center-left. This way, whenever we change the width of the polygon, it will increase its width to the right side. Because the anchor point was changed, we need to adjust the position of the polygons:
image

In the code component, we are going to set the width of the polygon to be equal to the current money we have / 8000 (the maximum amount we can have):

# Begin Routine:
polygon_green.size = (win_sum/8000, 0.1)
polygon_red.size = (lose_sum/8000, 0.1)

Don’t forget to change the color of the marker to white and remove the previous marker code.

And this is the result:

Download the example here:
pb.zip (2.9 KB)

Let me know if it’s clear :slight_smile:
Chen

1 Like

Hi Chen,

Thank you for explaining to me how to create a progress bar without explicitly using sliders. I will have to consider whether I will be using this new method as it might complicate the code I have already generated for my own specific experiment. I will be playing a bit with it to decide on my option. Otherwise, the example is clear to me.

Many thanks once again!

1 Like

Hey,
No problem, glad I could help :slight_smile:

Chen

Just wanted to let you know that I have finally modified it to my needs and it fully works! The “progress bar” with your suggested feature of using polygons is much better than the slider’s limited version!

I have one more tiny question related to the polygons: How do I make the polygon not go beyond the value of 0 visually when the value goes into the minus of the scale? Is there a code command for it?

Many thanks for your help!

1 Like

Hey,
Were you using this code?

# Begin Routine:
polygon_green.size = (win_sum/8000, 0.1)
polygon_red.size = (lose_sum/8000, 0.1)

If yes, you can make the following condition:

if win_sum < 0:
    polygon_green.size = (0.01, 0.1)
else:
    polygon_green.size = (win_sum/8000, 0.1)

if lose_sum < 0:
    polygon_red.size = (0.01, 0.1)
else:
    polygon_red.size = (lose/8000, 0.1)

Was it your intention?

Thanks,
Chen

1 Like

Hi Chen,

Yes, it was my intention. Now I have modified it into my own version and it fully works! It stops at the value of 0 as I wanted.

Thank you so much!

1 Like

No problem! :slight_smile: