How do I display gray-scale images available as 2D numpy array? I think this was discussed on the old forum, but I can’t find the solution anymore. Thanks.
Indeed, GratingStim should work with gray-scaled images. Is there a more general method that will work with full color image, ie. when a matrix for each of the RGB channels is provided?
ATM, the imshow method from opencv library seems to better fit what I’m trying to achieve.
ImageStim and GratingStim can both take RGB numpy arrays. GratingStim is appropriate if you want multiple cycles of your image/texture and ImageStim is for when you don’t.
What these do better than imshow is they load your array onto the graphics card in advance (so timing is good) and can then modify the shape/position/size/opacity/… on the fly with minimal overhead.
I would prefer ImageStim, but how do I supply the numpy array to the constructor? Should I just link it with the image keyword instead of the filename string?
EDIT: Ok, so it seems that ImageStim constructor accepts numpy array as image argument
Does ImageStim also accept a 3D numpy array? I’m having trouble displaying one. The colors appear seemingly random, and size arguments get ignored.
Make sure the image array is contiguous. Try passing the array first to ascontiguousarray with the appropriate dtype set.
Thank you for the suggestion! I tried this and it didn’t change the behavior at all. The 3D numpy array contains values between 0 - 255. Dimensions 1 and 2 are width and height of the image, and dimension 3 are each of the rgb channels.
I can’t upload npy files to discourse, but here is an example of a relevant portion of the code:
#All of the default packages imported by PsychoPy after I exported code from Builder)
from psychopy import locale_setup
from psychopy import prefs
from psychopy import sound, gui, visual, core, data, event, logging, clock
from psychopy.constants import (NOT_STARTED, STARTED, PLAYING, PAUSED,
                                STOPPED, FINISHED, PRESSED, RELEASED, FOREVER)
import numpy as np  # whole numpy lib is available, prepend 'np.'
from numpy import (sin, cos, tan, log, log10, pi, average,
                   sqrt, std, deg2rad, rad2deg, linspace, asarray)
from numpy.random import random, randint, normal, shuffle
import os  # handy system and path functions
import sys  # to get file system encoding

from psychopy.hardware import keyboard

#Initialize window
win = visual.Window(size=(900, 900))

image=np.load('image_to_view.npy') #this array is a class 'numpy.ndarray' of dimensions (202,220,3).
stim=visual.ImageStim(win,image=image,colorSpace='rgb255',)

##I exported from builder initially, so the code to actually visualize in mine contains much more, but here is the most basic way I can replicate
stim.draw()
win.flip()
core.wait(5.0)

# close the window
win.close()
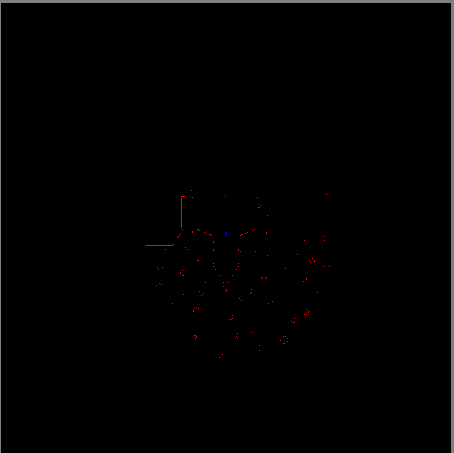
This is what the image should look like:
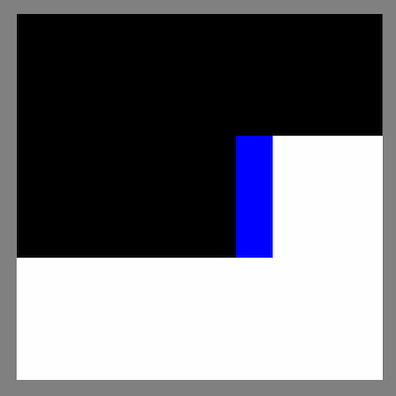
Here is a screenshot of what is being displayed:

EDIT: I tested whether it was only showing only the first index from the array (i.e., image[:,:,0]). Deliberately only displaying an array of image[:,:,0] produced a similar speckled shape, but it was black and white. I’m quite stumped!
Thanks so much!
Hi, it’s me again! I’m making some progress but still hitting some strange walls. Changing the dtype helped. The image shows up closer to what’s expected, but the colors are off. I tried with more simple by trying to visualize a blue square in rgb255. It made me realize that I’m not sure how ImageStim interprets the dimensions of a 3D numpy array. For example, if I wanted a 10x5 blue square, my intuition says I should do something like:
image=np.zeros((10,5,3),dtype='int16')
image[:,:,2]=255
The idea being that the first 2 dimensions are the height and width, and the 3rd axis is the color channels. This does not seem to be the case, so I tried:
image=np.zeros((3,10,5)
image[2,:,]=255
This gets closer to what I expected. Here is what I tried in full:
##Load packages
from psychopy import locale_setup
from psychopy import prefs
from psychopy import sound, gui, visual, core, data, event, logging, clock
from psychopy.constants import (NOT_STARTED, STARTED, PLAYING, PAUSED,
                                STOPPED, FINISHED, PRESSED, RELEASED, FOREVER)
import numpy as np  # whole numpy lib is available, prepend 'np.'
from numpy import (sin, cos, tan, log, log10, pi, average,
                   sqrt, std, deg2rad, rad2deg, linspace, asarray)
from numpy.random import random, randint, normal, shuffle
import os  # handy system and path functions
import sys  # to get file system encoding

from psychopy.hardware import keyboard

##Initialize window
win = visual.Window(size=(900, 900))

##Blue square
image=np.zeros((3,10,5),dtype='int16')
image[0,:,:]=255
image=np.ascontiguousarray(image,dtype='int16')  #just in case!
stim=visual.ImageStim(win,image=image,colorSpace='rgb255',interpolate=False,flipVert=True)

##Flip to screen
stim.draw()
win.flip()
core.wait(3.0)

##Close the window
win.close()
This produces the following image:

This seemed promising aside from the additional black and white areas. I tried making a red square using the same code but instead of image[0,:,:]=255, I tried image[2,:,:]=255.
This produced an all white square.

What this suggests to me is that the color channels are interpreted along a different axis than I’m expecting. I’m not sure though. I’ve tried assigning colors by changing rows and columns, and it will produce colorful lines, but I’m having trouble tracing the relationship between numerical positions and the colors/position of colors produced.
I think I could greatly benefit from a successful example. Does anyone have an example of loading in a 3D numpy array with an rgb255 colorspace and displaying an image from it?
Thanks!
