Hi there! I am running a self-paced reading tasks using psychopy 3 on Mac. Today when I piloted the study, it went well. Only a minor thing. When I analysed the data in the file with CVS extension, I noticed the cells for sentences with no YES/NO comprehension questions were also filled with the value 1, indicating a right answer (please see the pic attached: in the column: qresp.corr
How can I make sure these cells display something like “none”, instead of “1” or “0”, indicating right or wrong answers? Thanking you in anticipation.
We can’t see from your screenshot what the correct answer column contains (in Excel, you can hide columns, so they still exist but allow you to show columns as neighbouring even though they are widely separated). i.e. if that column contained a 'None' value for that trial, then no response would indeed be recorded as a correct response.
But it isn’t really clear what you are asking for. Are you saying that the correct answer was something other than 'None', yet the response was still recorded as correct? We really need some more details of how your keyboard component is set up, and what you want to be happening for every combination of responses and correct answers.
Hi Michael. Thank you very much for your reply. I have attached here the self-paced reading experiment I built, one condition file to be used in my study, and also one data file I got when I did the experiment. My aim is basically to get participants’ reaction times for each word of the sentences, as well their accuracy rates for the comprehension questions. Could you please help me with four minor questions before I really start collecting data?
Firstly, as you can see in the data file, each column for the reaction times was named as word_0/1/2… instead of starting from word 1.Does this influence the reaction times data? Or it won’t be a problem so long as I counting from word 0 as the first word of the sentence when I analyse the data.
Secondly, as for the results of their response as in the column called “qresp.corr”, even when their is no questions following the sentence, it would automatically register as “1”.
Thirdly, I found sometimes the column called “qresp.corr” appear in the middle somewhere between the columns for word reaction times, e.g. word_7; qresp.corr; word_8. instead of at the end of the last word of all sentences. Would it affect my reaction time data?
Lastly, it would be most kind of you if you could help me have a look at the experiment I build and see whether there is any problem that may prevent me from getting the data I want. I want to make sure it is working great before I really start collecting data several days later. Thanks a lot!
For historical reasons, many computer languages like Python count from 0. So yes, in this case, you should regard the first word as being word 0, the second as word 1, etc. This is driven by this sort of custom code that you have:
for rts in range(len(rtList)): # will start counting from 0.
        trials_2.addData('word_{}'.format(rts), rtList[rts])
I guess this is because the number of words is variable. If the first trial had a sentence had 8 words, but the second had 20, then the order of columns would be set by what occurred on the first trial. Note that this might mean that your data files across subjects will not necessarily line up. This is OK if you have software for analysis that can join tables by column name rather than column position, but you need to be aware of this at the analysis stage. This could be a very good reason for using R or similar, rather than trying to join files using Excel or similar, which will be painful and prone to errors. R (and in particular the dplyr and tidy packages) are particularly good for the sort of manipulation you will need on this sort of data. In particular, you will want to get your response times from multiple columns (e.g. word_0, word_1 etc into a single rt column, with a corresponding key column that relates each to its word order. i.,e. you will want to reshape this data set from a wide format (multiple RT columns, with one row per trial) to a long format (a single RT column, with one row per word). tidy makes this sort of manipulation very easy. Some resources here:
Also, you should set the keyboard components on routines that aren’t of interest (e.g. just pushing a key to move on from an instructions screen) to not store any data. This will prevent some of the bank row that are otherwise polluting your data file.
Hi Michael. Thanks for your help and advice. I thank it over and decide not to do any change`Preforms since it does not interfere with the data I want. As you can see in the screenshot, the column before the “qresp.corr” already told me whether the sentence is followed by questions or not: i.e. none mean no questions. So I can work out their accuracy simply by counting the numbers of “0” out of the total.
Another minor question about the data analysis. Since I am only interested in the RTs for a specific word, and also the sum of several specific words for a particular sentences. In the experiment, the order of these sentences is randomised, so the orders are different for the data file of different participants. Thus I wrote a code using Python on the Jupiter Notebook, which can produce the results automatically in the exact order I want (I locate the data using the column name, e.g. word_5…Please see the attachment). Is this Ok?
That sounds perfect (and good to keep the analysis within Python too). This is a really good practice (getting your analysis pipeline in place while doing your pilot testing), to avoid any nasty surprises.
But to be honest, really nervous now before really collecting data haha. For example, I would worry the experiment I design cannot give me reliable reaction times… Could you please help me have a look at whether the experiment(please see the attachment above) I designed is good based on the purpose I describe? Thanks a millionnnnn…
I’ll look further if I get a chance. But for the timebeing, the .csv file shows that you are using PsychoPy 3.0.5. You should update to the latest version (currently 3.1.2), and test once again before running the experiment. Version 3.1 introduced improved measurement of keyboard response times, particularly for Builder-generated scripts (they previously had a 16 ms granularity in reaction time measurements, which has now been eliminated).
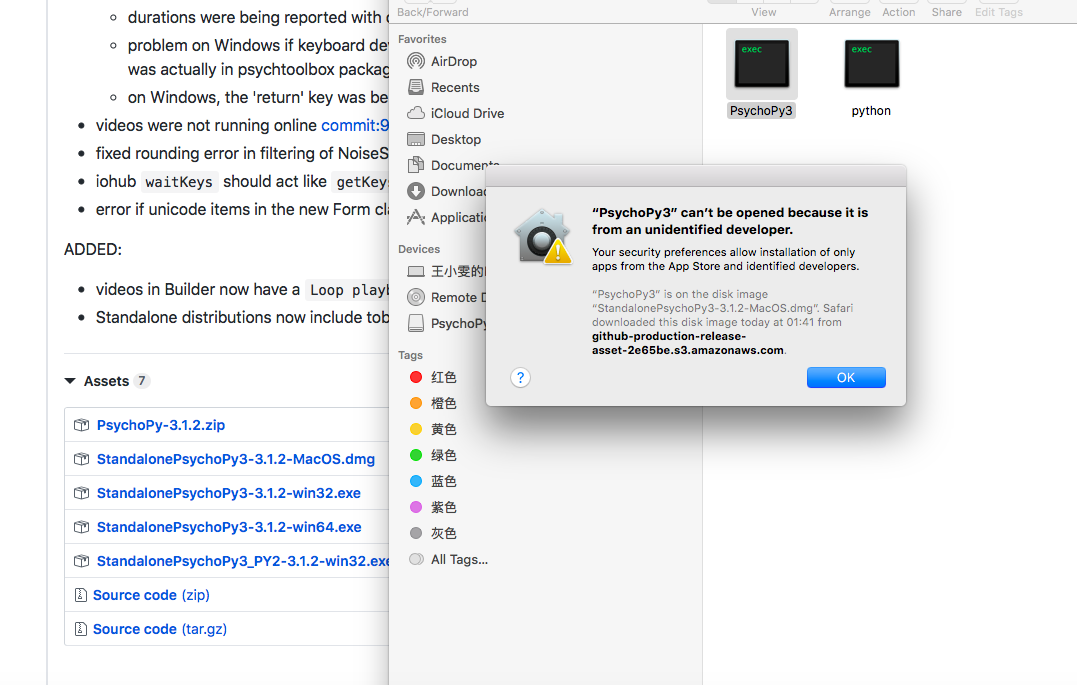
Thanks Michael! Just now I tried to download the updated version from this website, but found I cannot open it on my laptop? How can I fix it? Also, how can I differentiated this one with the older version that already existed in my laptop, and both seems to be labelled as Pychopy 3… Thanks!
Thanks a lot Michael!! I 've updated the newest version and it seems to work fine. I attached the experiment and the data file of the pilot. Could you please help me check whether everything is working well? I want to be 100% safe for my graduation dissertation. Thanks!!!Final study-demo.psyexp (30.2 KB)
Hi Michael. I also got one minor question. The data file would present the reaction times in the unit of second instead of millisecond. How should I deal with that? Thanks.